Stat 200 WEEK 2 SUMMARIZING AND GRAPHING
in Other (Education) by neel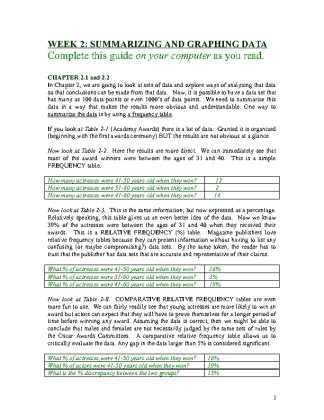
Your Price: $95.00 (30% discount)
You Save: $40.71
Description
WEEK 2: SUMMARIZING AND GRAPHING DATA
Complete this guide on your computer as you read.
CHAPTER 2.1 and 2.2
In Chapter 2, we are going to look at sets of data and explore ways of analyzing that data so that conclusions can be made from that data. Now, it is possible to have a data set that has many as 100 data points or even 1000's of data points. We need to summarize this data in a way that makes the results more obvious and understandable. One way to summarize the data is by using a frequency table.
If you look at Table 2-1 (Academy Awards) there is a lot of data. Granted it is organized (beginning with the first awards ceremony) BUT the results are not obvious at a glance.
Now look at Table 2-2. Here the results are more direct. We can immediately see that most of the award...
