QNT 351 Week 3, Individual Assignment My StatsLab
in Mathematics by neel
Favorite
Add it to your favorites and revisit later
Instant Download
Previewing 1 of 15 total pages.
Regular Price: $28.57
Your Price: $20.00 (30% discount)
You Save: $8.57
Your Price: $20.00 (30% discount)
You Save: $8.57
Description
Week 3 Problems
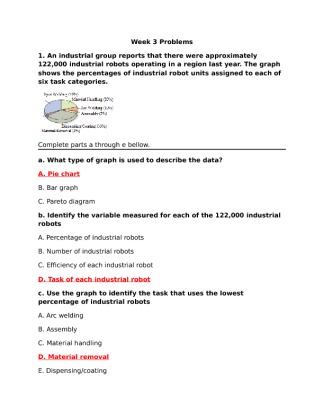
- An industrial group reports that there were approximately 122,000 industrial robots operating in a region last year. The graph shows the percentages of industrial robot units assigned to each of six task categories.
Complete parts a through e bellow.
a. What type of graph is used to describe the data?
A. Pie chart
B. Bar graph
C. Pareto diagram
b. Identify the variable measured for each of the 122,000 industrial robots
A. Percentage of industrial robots
B. Number of industrial robots
C. Efficiency of each industrial robot
D. Task of each industrial robot
c. Use the graph to identify the task that uses the lowest percentage of industrial robots
A. Arc welding
B. Assembly
C. Material handling
D. Material removal
E. Dispensing/coating
F. Spot welding
d. How many of the...
Comments (0)
You must sign in to make a comment.

Rating:
Published On:
06/09/2015
Print Length:
15 page(s)
Word Count:
1,572
File Name:
qnt-351-week-3-individual-assignment-my-statslab-80.docx
File Size:
221.70 KB (0.22 MB)
Sold By:
neel
Purchased:
0 times
Best Seller Ranking:
#26097