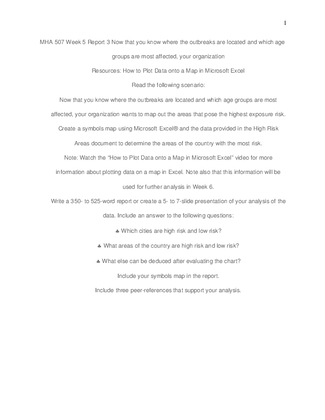
MHA 507 Week 5 Report 3 Now that you know where the outbreaks are located and which age groups are most affected, your organization
in Other (Other) by vommsYour Price: $7.50 (30% discount)
You Save: $3.21
Description
MHA 507 Week 5 Report 3 Now that you know where the outbreaks are located and which age groups are most affected, your organization Resources: How to Plot Data onto a Map in Microsoft Excel Read the following scenario: Now that you know where the outbreaks are located and which age groups are most affected, your organization wants to map out the areas that pose the highest exposure risk. Create a symbols map using Microsoft Excel and the data provided in the High Risk Areas document to determine the areas of the country with the most risk. Note: Watch the How to Plot Data onto a Map in Microsoft Excel video for more information about plotting data on a map in Excel. Note also that this information will be used for further analysis in Week 6. Write a 350- to 525-word report or...


