Mat540 Assign 3
in Mathematics by vomms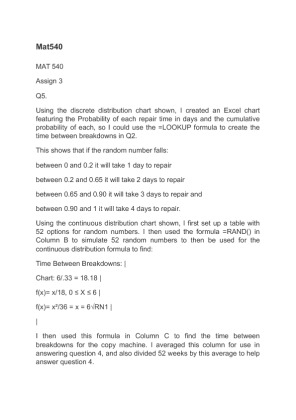
Your Price: $6.99 (30% discount)
You Save: $3.00
Description
Mat540
MAT 540
Assign 3
Q5.
Using the discrete distribution chart shown, I created an Excel chart featuring the Probability of each repair time in days and the cumulative probability of each, so I could use the LOOKUP formula to create the time between breakdowns in Q2.
This shows that if the random number falls:
between 0 and 0.2 it will take 1 day to repair
between 0.2 and it will take 2 days to repair
between and it will take 3 days to repair and
between and 1 it will take 4 days to repair.
Using the continuous distribution chart shown, I first set up a table with 52 options for random numbers. I then used the formula RAND() in Column B to simulate 52 random numbers to then be used for the continuous distribution formula to find:
Time Between Breakdowns:
Chart:...
