com220 week4 reading2
in Business (Education) by neel
Favorite
Add it to your favorites and revisit later
Instant Download
Previewing 1 of 4 total pages.
Regular Price: $28.57
Your Price: $20.00 (30% discount)
You Save: $8.57
Your Price: $20.00 (30% discount)
You Save: $8.57
Description
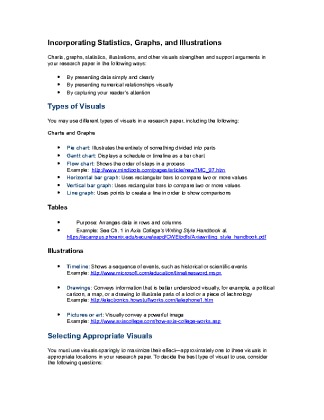
Incorporating Statistics, Graphs, and Illustrations
Charts, graphs, statistics, illustrations, and other visuals strengthen and support arguments in your research paper in the following ways:
By presenting data simply and clearly
By presenting numerical relationships visually
By capturing your reader's attention
Types of Visuals
You may use different types of visuals in a research paper, including the following:
Charts and Graphs
Pie chart: Illustrates the entirety of something divided into parts
Gantt chart: Displays a schedule or timeline as a bar chart
Flow chart: Shows the order of steps in a process
Example:
Horizontal bar graph: Uses rectangular bars to compare two or more values
Vertical bar graph: Uses rectangular bars...
Comments (0)
You must sign in to make a comment.

Rating:
Published On:
06/09/2015
Print Length:
4 page(s)
Word Count:
1,061
File Name:
com220-week4-reading2-94.docx
File Size:
34.04 KB (0.03 MB)
Sold By:
neel
Purchased:
0 times
Best Seller Ranking:
#25876