COM220 Week 5 Assignment Incorporating Statistics, graphs, and illustrations
in Business (Education) by neel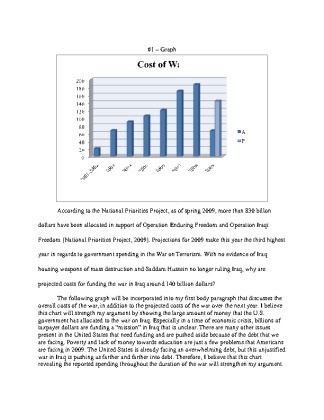
Your Price: $10.00 (30% discount)
You Save: $4.29
Description
1 - Graph
According to the National Priorities Project, as of spring 2009, more than 830 billon dollars have been allocated in support of Operation Enduring Freedom and Operation Iraqi Freedom (National Priorities Project, 2009). Projections for 2009 make this year the third highest year in regards to government spending in the War on Terrorism. With no evidence of Iraq housing weapons of mass destruction and Saddam Hussein no longer ruling Iraq, why are projected costs for funding the war in Iraq around 140 billion dollars?
The following graph will be incorporated into my first body paragraph that discusses the overall costs of the war, in addition to the projected costs of the war over the next year. I believe this chart will strength my argument by showing the large amount of...
