Assignment week 5 Incorporating Statistics, Graphs, and Illustrations
in Mathematics by neel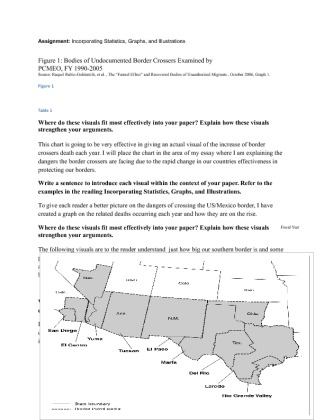
Your Price: $30.00 (30% discount)
You Save: $12.86
Description
Assignment: Incorporating Statistics, Graphs, and Illustrations
Figure 1: Bodies of Undocumented Border Crossers Examined by
PCMEO, FY 1990-2005
Source: Raquel Rubio-Goldsmith, et al. , The "Funnel Effect" and Recovered Bodies of Unauthorized Migrants , October 2006, Graph 1.
Figure 1
Table 1
Where do these visuals fit most effectively into your paper? Explain how these visuals strengthen your arguments.
This chart is going to be very effective in giving an actual visual of the increase of border crossers death each year. I will place the chart in the area of my essay where I am explaining the dangers the border crossers are facing due to the rapid change in our countries effectiveness in protecting our borders.
Write a sentence to introduce each visual within the context of your...
