MAT 101 Stats
in Mathematics by Euler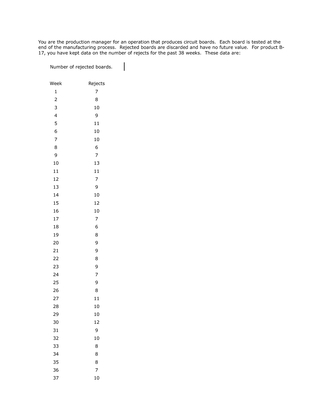
Your Price: $5.99 (30% discount)
You Save: $2.57
Description
You are the production manager for an operation that produces circuit boards. Each board is tested at the end of the manufacturing process. Rejected boards are discarded and have no future value. For product B-17, you have kept data on the number of rejects for the past 38 weeks. These data are:
Number of rejected boards.
Week
Rejects
Prepare a frequency distribution chart.
What is the Standard Deviation?
What is the approximate probability that at least 7 rejected boards will be produced next week?
Be sure to clearly show how you arrived at your conclusion.
To get you started with a frequency distribution table:
Number of Boards Rejected in a Week
Frequency
6
2
7
6
8
7
You will have to complete the rest of the table yourself to answer the assignment questions.
Case assignment expectations:
Use information from the modular background readings as well as any good quality resource you can find. Please cite all sources and provide a reference list at the end of your paper.
The following items will be assessed in particular:
-
Your ability to describe the information provided by the Standard Deviation.
-
Your ability to use the Standard Deviation to calculate the percentage of occurrence of a variable either above or below a particular value.
-
Your ability to describe a normal distribution as evidenced by a bell shaped curve.
- Your ability to prepare a distribution chart from a set of data.
